WCWH: Turning Complex Health Data into Human-Centered Insights
How I researched and redesigned WCWH’s Health Data Reports to make health results more accessible, empathetic, and easy to understand
My Role
UX Researcher
Competitive analysis
Usability testing
UX Designer
Rapid prototyping
Research Operations
Participant management
1
Understand the Challenge
Team
3 UX Designer/Researcher
2
Solution Design

Duration
February 2025 - Present
Problems with the Original Report
Text-Heavy & Overwhelming
Dense paragraphs with little visual hierarchy
Users must sift through long text blocks to find relevant details
Complex Medical Jargon
Technical terms are not explained in plain language
Creates confusion and leaves many readers unsure about what their results mean
Unclear Structure
Information is not prioritized or broken down into digestible sections
Important insights are buried in long sentences instead of being highlighted
Lack of Engagement
The design looks formal and static, similar to an academic or government report
No visual elements (icons, color cues, charts) to keep readers interested
Accessibility Concerns
Long blocks of copy and jargon-heavy language make it hard for readers with varying literacy levels or accessibility needs
Not designed for quick scanning or diverse community use
Tools
Figma
Miro
Zoom
MAXQDA
Participants want to understand their health results,
but complicated graphs, lack of guidance, and emotionally sensitive data
left them confused and discouraged.
Overview
Whole Communities- Whole Health (WCWH) is a research initiative at UT Austin that aims to provide accessible healthcare resources to the Austin community and return data back to participants in the form of digital reports.
The Health and Wellness Report focuses on the participants’ physical and mental health. My goal was to ensure the report was clear, accessible, and resourceful.
The Pain
Health reports are often boring, overly complex, and lack actionable guidance, leaving users confused and disengaged from their own health
Traditional health reports are often difficult for people to engage with. They tend to be text-heavy, filled with medical jargon, and disconnected from users’ real needs. As a result, many individuals struggle to understand their results, feel overwhelmed by the complexity, and lack clear next steps or resources to support their health journey
Impact Glance
Challenge: Presenting emotionally sensitive mental health data clearly so that users can interpret it confidently
Solution: Include an example graph to guide participants in reading their results, and provide the community result range as a reference for interpretation
Result: Completed 3 rounds of testing and iterations with 16 participants, leading to an improvement in participant comprehension from 20% to 60%
3
User Testing
4
Reflecting
Understand the Challenge

Solution Design

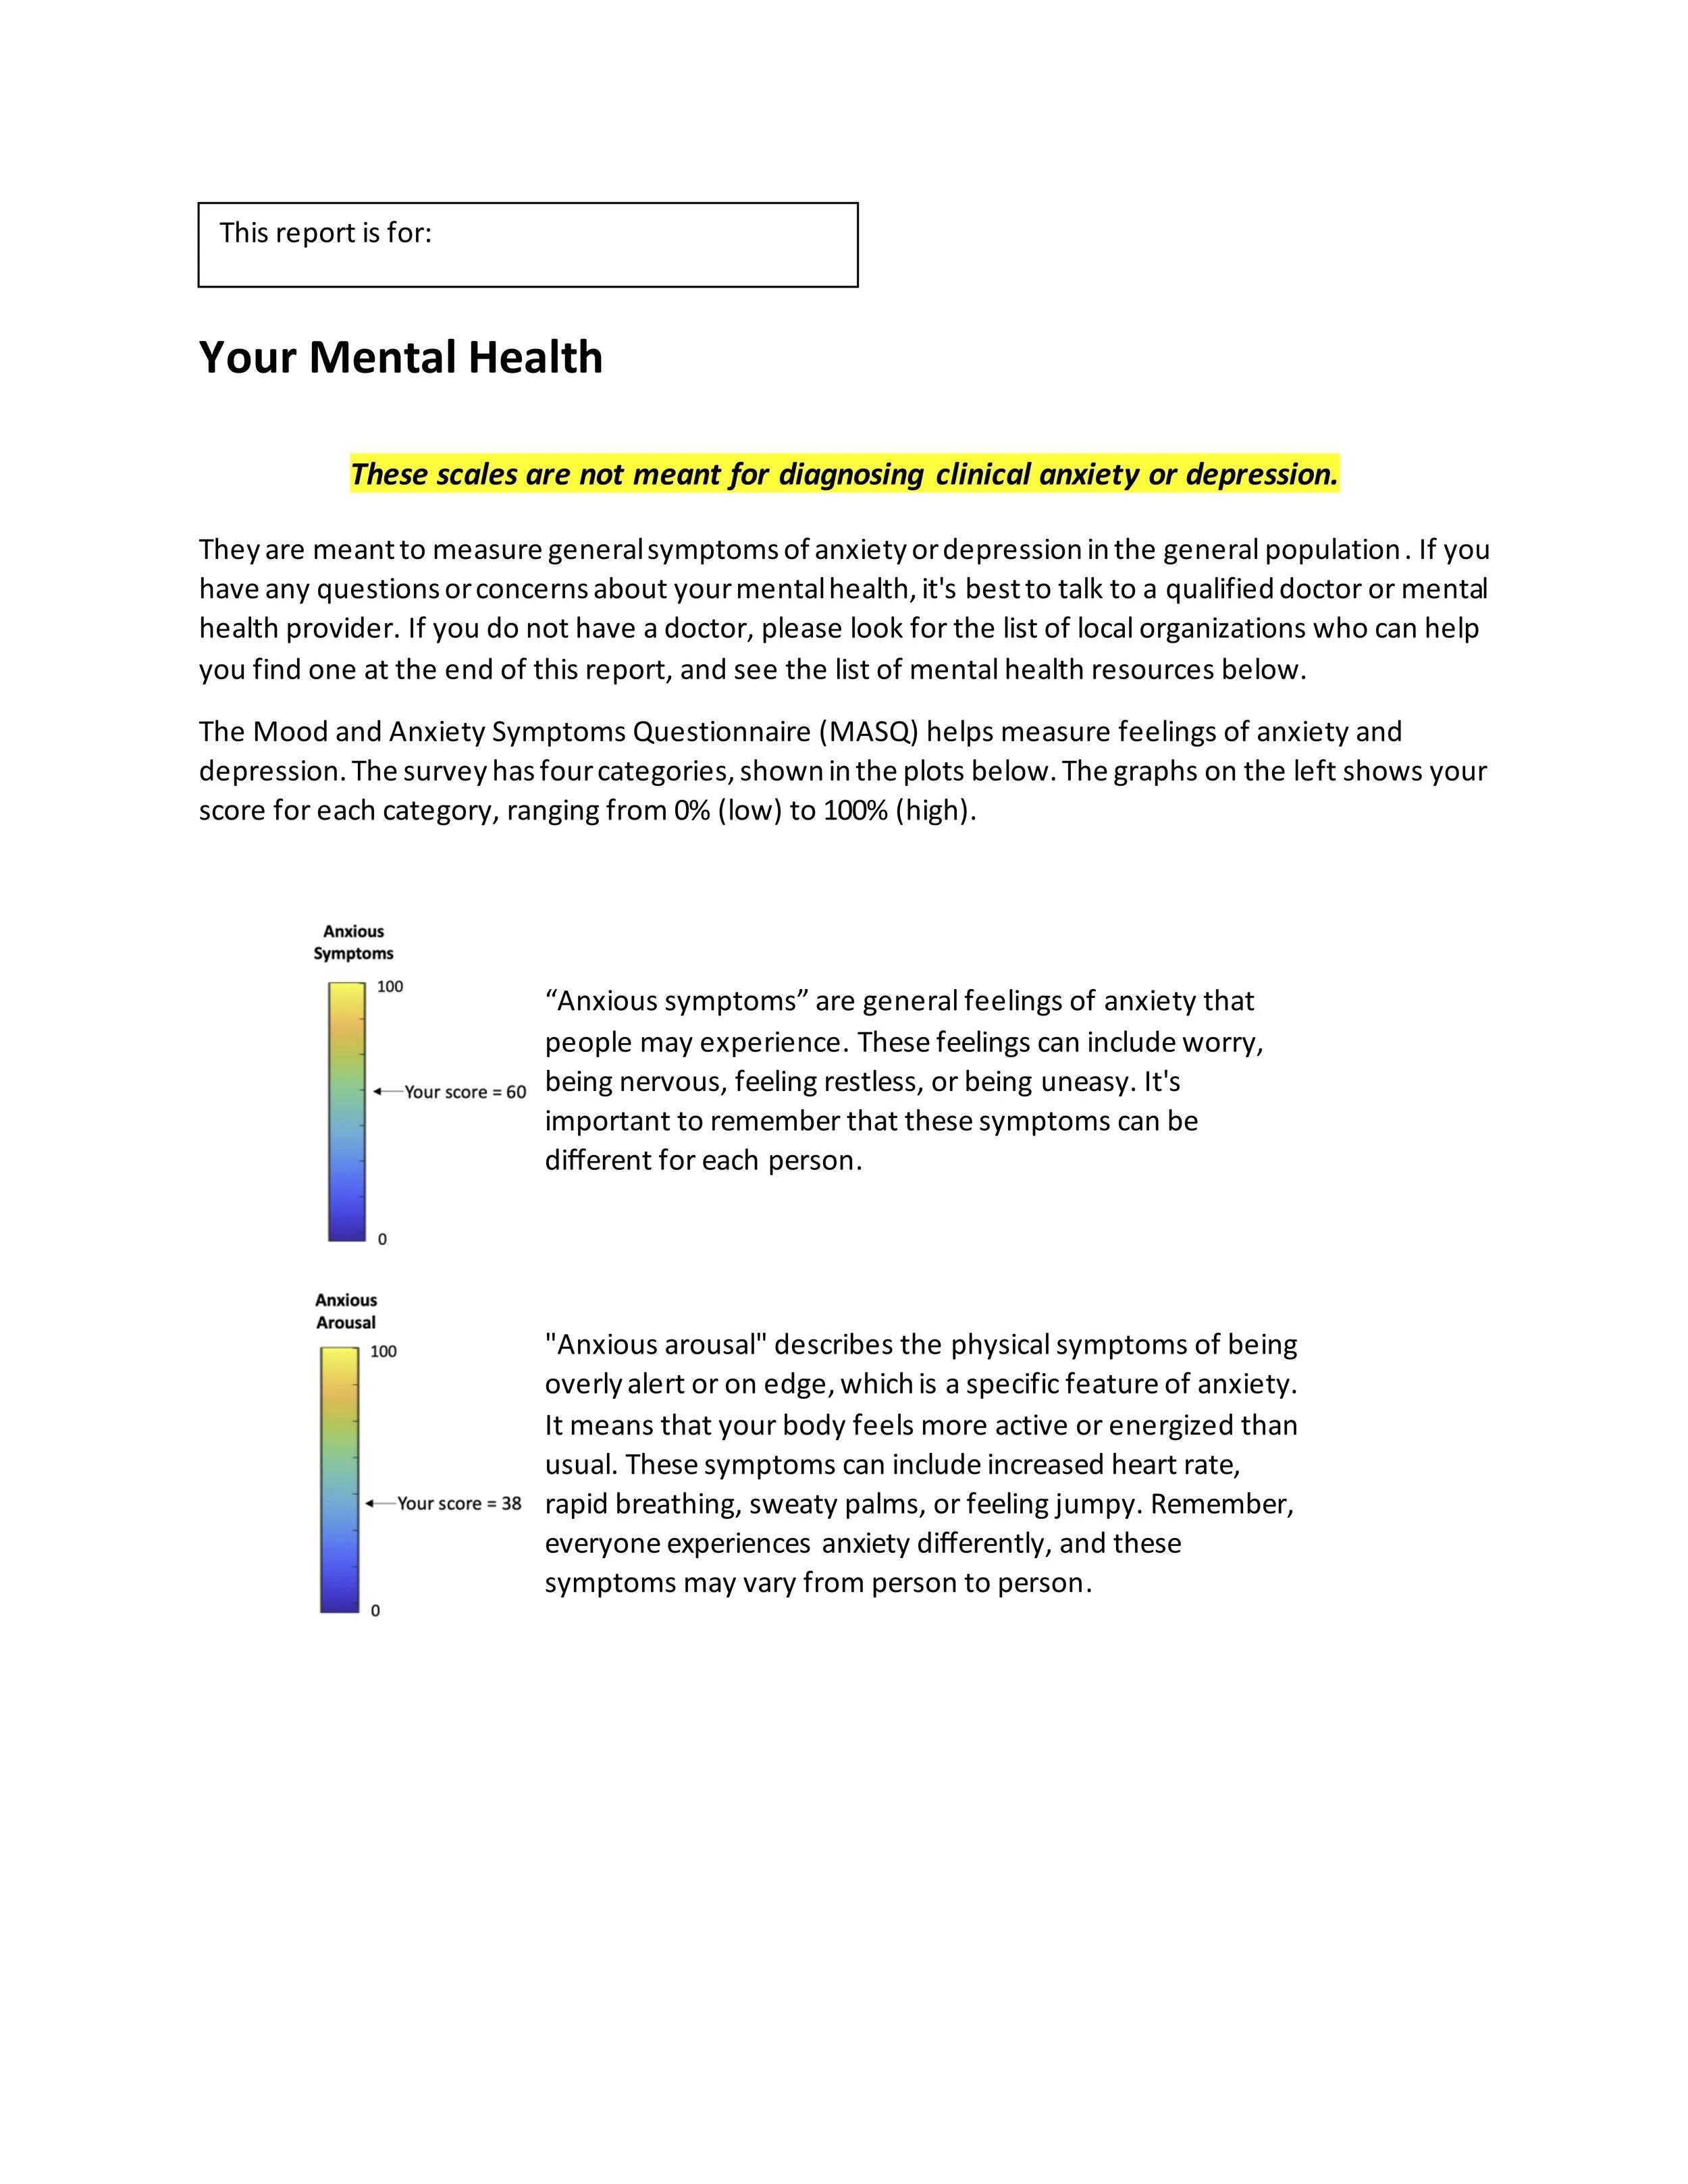
Clarifying Mental Health Results
Problem: Mental health data was difficult to interpret without additional guidance
Solution: Introduced a box graph to represent results for clarity and added an “example graph” to show how to interpret the results
Why this solution: Visualizing data with clear reference points makes abstract results easier to understand and lowers the barrier for users unfamiliar with graphs. By including the “example graph”, users can use that as their guidance if still needed support